Having a completed list of work is not the best factor to use while determining the visibility and effectiveness of the work done by an Agile team. This is because it may not account for the possible hindrance, difficulties, or extra steps that may be present during the workflow.
This is why it is important for Scrum Masters to help ensure that work becomes visible. Visualization of the team flow helps in identifying bottlenecks and observing where work flows smoothly and where it does not, which can help teams make better choices about priorities, workload distribution, and collaboration.
What Is Team Flow?
Team flow is defined as the transition of work from an initial idea or work item to a completed product; everything that happens to an item through its development, testing, and review phases is also accounted for. Having a good flow means that work moves steadily from each phase without too much waiting, multitasking, reworking, or with the appearance of hindrances.
Visualizing this flow gives Scrum Masters and teams clarity into how work progresses and behaves rather than depending on assumptions and individual updates on work status. Having a well-visualized board depicting workflow can show the different stages of work while making queued-up tasks, blocked items, and incomplete work apparent.
Scrum masters play an important role in helping visualize this workflow since it plays a huge part in enabling teams to do their work more efficiently. For experienced Scrum professionals seeking to elevate their Scrum and SAFe knowledge, joining the SASM Certification program is highly recommended to help them learn advanced skills for improving workflow in high-performing Agile teams.
Use a Team Board to Make Work Visible
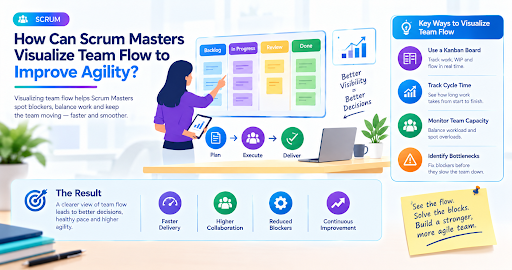
One of the easiest ways to make team flow visible is by using a Scrum or Kanban board. Most columns on these boards will include categories like ‘Backlog,’ ‘Ready,’ ‘In Progress,’ ‘Review,’ ‘Testing,’ and ‘Done.’
The workflow that is depicted on the board should actually reflect the way in which the team functions and delivers value. After this visual representation, Scrum Masters can work with their teams to identify unnecessary steps in the workflow and clarify what completion can look like for moving work between stages.
The board should be able to answer these questions:
- What work has not yet started and needs to start?
- What work is currently in progress?
- What work has been completed?
Answering these questions and keeping them in mind while planning helps teams stay focused on finishing work that is already in the pipeline rather than picking up new initiatives to work on.
Use Cumulative Flow Diagrams
Cumulative Flow Diagrams (CFDs) are visual tools that show how work items move through different workflow states over time. The X-axis represents time, while the Y-axis represents the number of work items. Each colored band represents a workflow state, such as “To Do,” “In Progress,” “Testing,” or “Done.” Changes in the width of these bands can help teams identify growing queues, bottlenecks, or changes in work-in-progress levels.
For example, if a testing band becomes wider while the development band shows steady progression, a team may be having more work entering testing than is possible. This indication can help Scrum Masters take necessary actions, like facilitating a discussion to manage the amount of work entering the testing stage.
Thus, the CFD turns an invisible or obscure problem into something tangible for the team to see, process, and discuss.
Track Key Flow Metrics
Visualizations become easier when there are metrics present to help support them. Some metrics that a Scrum Master can monitor include the following:
1. Work in Progress (WIP)
WIP depicts work that has started but has not been completed yet. Too many WIPs can lead to multitasking, longer queues, and switching between contexts. To help avoid this, teams can set up a WIP limit that will encourage completing tasks before picking up new ones.
2. Cycle Time
Cycle time is the duration that it takes an item to move from the beginning of the workflow to completion. Keeping track of the cycle time helps teams detect whether delivery is becoming slower, faster, or unpredictable.
3. Throughput
Throughput refers to the actual number of work items that are completed during a particular period of time. This metric counts the completed number of work items rather than the size of the work items.
4. Work Item Age
The age of a work item shows how long unfinished items have remained in progress. Items that remain in the same workflow stage for a long period may indicate an impediment or bottleneck that requires attention.
Identify and Address Bottlenecks
Visualizing the workflow helps teams take action against possible impediments that slow down the progress of work. Scrum Masters should keep a lookout for patterns like the following:
- A large queue forming before testing
- Stories remaining in review for several days
- Too many items being started together
- Blocked work repeatedly appearing in the same workflow stage
- Completed work declining while WIP continues increasing
These patterns help Scrum Masters and teams unearth the factors that stop work from progressing forward.
Visualize Flow in SAFe Environments
In SAFe, a Scrum Master can visualize team-level work and understand how it contributes to broader delivery objectives. Team dashboards can visualize the progress of work items, cycle time, and sprint performance. This helps teams connect workflow improvements with overall organizational goals while also focusing on delivering value.
To understand the SAFe and Scrum principles, professionals ought to explore the SSM Certification Course with Simpliaxis to learn the responsibilities of a Scrum Master within the Scaled Agile environment.
Conclusion
Visualizing team flow gives Scrum Masters a practical way to transform invisible workflow problems into opportunities to implement solutions. Boards help visualize and target problems; CFDs showcase how work behaves over a time period. Flow metrics serve as vital indicators about possible bottlenecks and help in measuring change.
When teams use the information from these visualizations to take measurable actions like limiting the WIP, removing impediments, experimenting with better ways of working, and improving collaboration, they can work more efficiently and deliver better results.